Intro

Greetings for the day! Welcome to my portfolio! I'm Ashish, a multilingual analytics professional with a passion for empowering data-driven decisions. My goal is to help organizations unlock the full potential of their data by delivering customized and innovative solutions that drive growth and success. With expertise in data analysis, machine learning, and more, I am committed to staying on the cutting edge of the latest technologies and trends in the industry. My approach is detail-oriented and business-minded, and I always prioritize understanding the unique needs and goals of my clients. In my portfolio, you'll find a showcase of my latest projects, highlighting my ability to deliver real-world results for a range of organizations. From predictive modeling and natural language processing to data visualization and deep learning, I have a proven track record of leveraging the latest tools and techniques to drive impactful insights and outcomes. At a time when data is more important than ever, I believe that the field of data science and machine learning has the potential to unlock tremendous value and drive transformative change across industries. By harnessing the power of data, we can make smarter decisions, gain a deeper understanding of our customers and stakeholders, and build more resilient and innovative organizations. So, whether you're looking to harness the power of data to drive growth and success or simply want to learn more about the exciting and ever-evolving field of data science and machine learning, I invite you to explore my portfolio and discover how I can help you achieve your goals. Also, you can have a quick look at my work and associated projects here.
Having more than 5 years of work experience within the perceptual industry, I have managed to develop strong expertise in consumer behavior research, social media activation, project management, advanced structural analysis, analytical decision modelling, advanced surveying, hyper parameter tuning, data pipeline architecture, workflow management and convolutional neural networking. Here, I'm enlisting my work endeavors that coincides with the job description and the required skills for the offered position and it's key roles & responsibilities that could possibly add value to your organization, that are :
Portfolio Projections
Here, we could have an subjective knowledge of the methodologies implemented to fulfill the acquired competencies. Interpreting data and generating useful reports. Prepared and operated databases and other system structures. Strengthened processes and aligned plans with operational needs. Strategic Planning & Database Management, Forecasting Ability, Data Warehousing Sequences as well as my distinct and versed experience with prominent languages including Python, Structured Query Language (SQL) and Visualization tools consisting Tableau and Data Studios. Statistic analysis expertise, Gap analysis, Data mapping, Data mining & wrangling using Excel etc.
 'A-Comprehensive-EDA-on-Global-Terrorism'
 'MKU--Employee-Sentiment-Anlaysis'
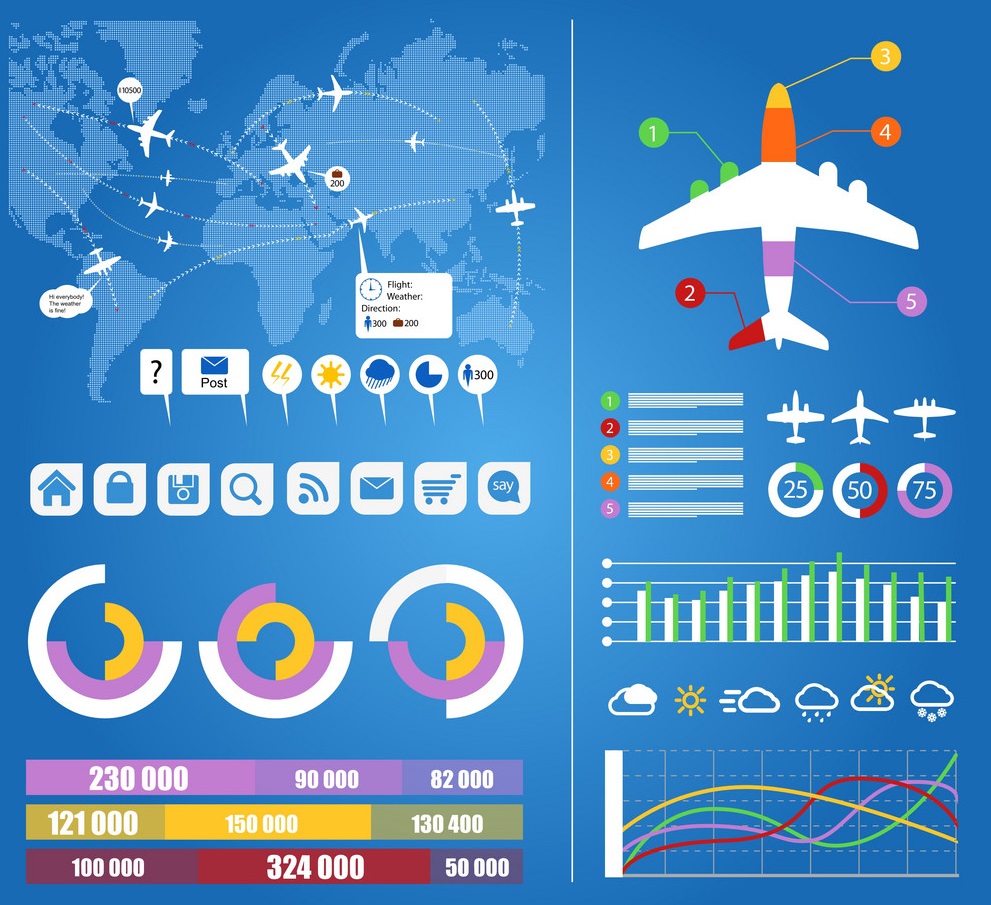 'Aviation-Accident-Analysis'
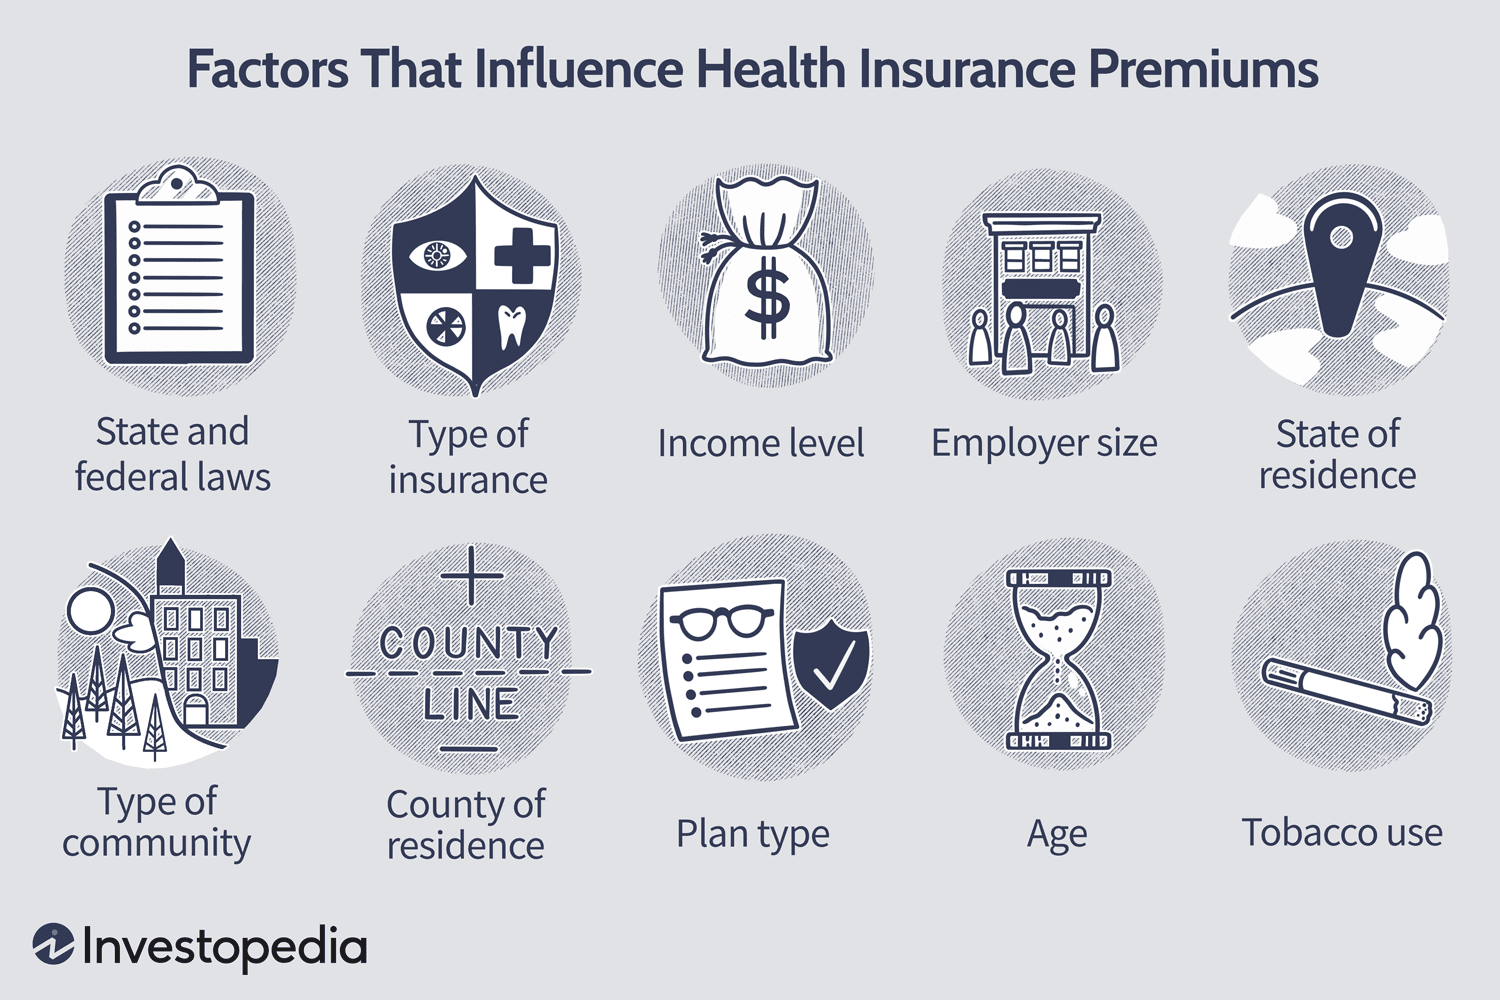 'Health-Care-Insurance-Costs-Analysis'
 'Exploring-My-FitBit-Data'
 'Time-Series-Forecasting-Predictive-Scheduling - Manifold DeepAR'
 'Used Bikes Dataset Descriptive Statistics'
 'Chat-Bot Iterations'
 'Amazon-Web-Scraper-Project'
 'Correlation - Matrix : Four Decades of Movies'
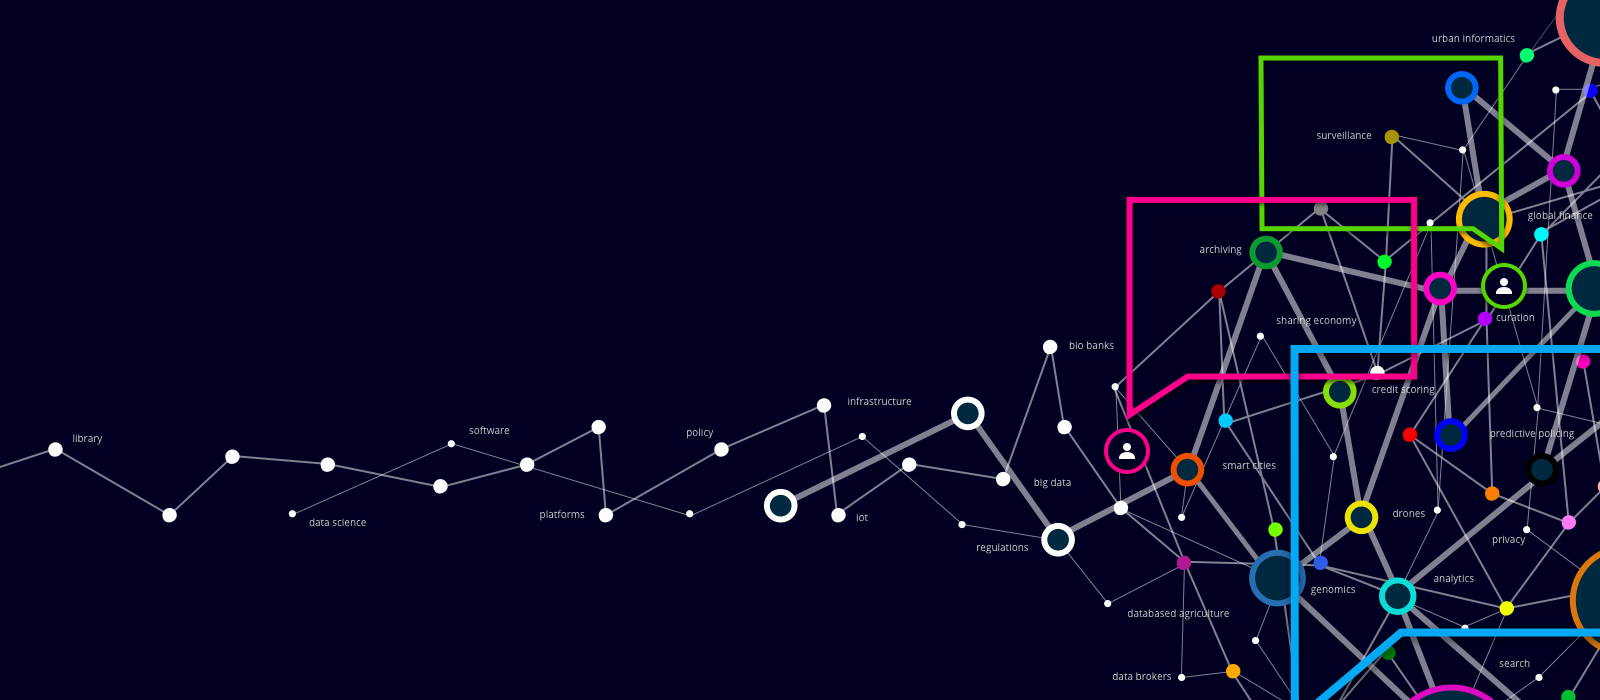 'Ashish Singh - Technex (IIT, BHU) (IIM, Lucknow) Data Analytics & Machine Learning Internship Project : Iris Data Set '
 'Covid-19-Pandemic-How-It-Affected-Us'
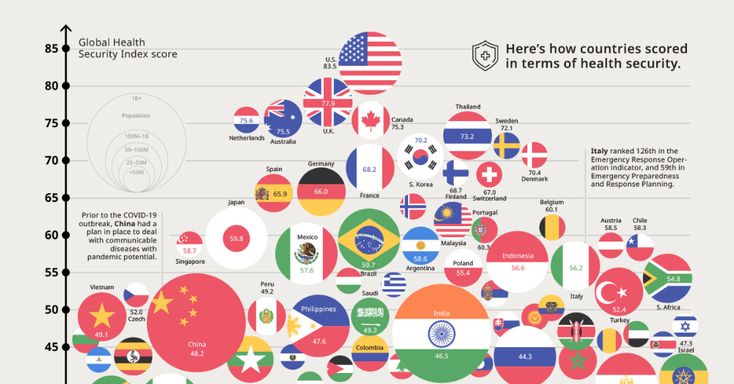 'Covid-19-Dashboard__Data-Visualization-Via-Tableau'
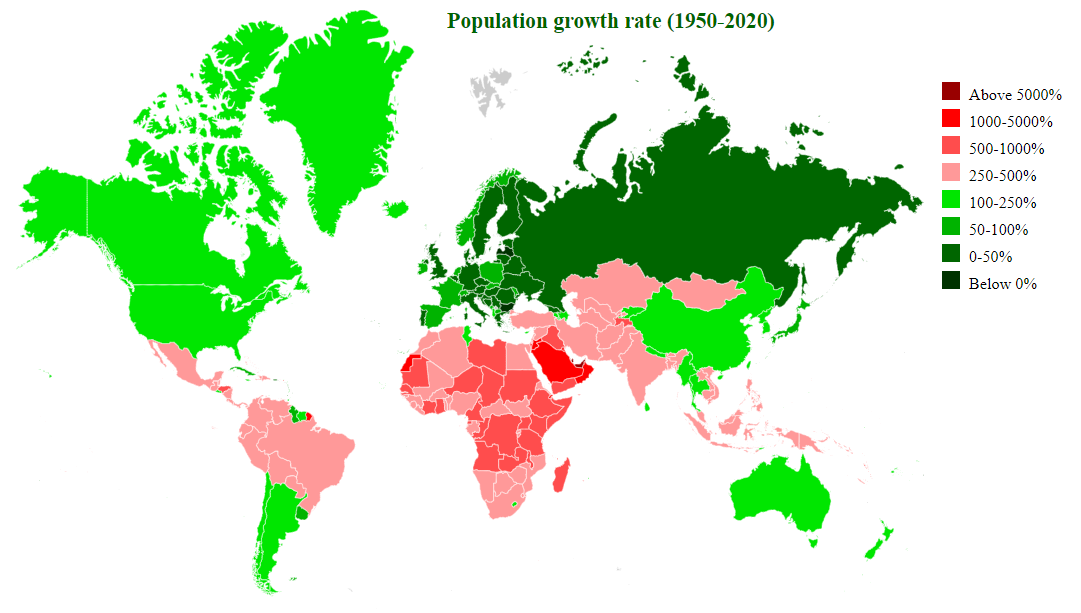 'Population--Growth__1950-2000'
 'Data Exploration : Nashville-Housing-Data'
 'Introdution-to-Python_Attributes-Functions'
About
Cover Letter
My workflow & skill-set intrinsically comprises of substantial data management and further accounts for conceptualizing and developeing relevant predictive analytical solutions.
Envisioning opportunistic areas with by demonstrating relevant and credible Predictive Analytics solutions and
paradigms. The role may carrying out high level assessment of Analytics readiness and creating the
associated analytic benchmarking which may ultimately converge into a specific Predictive Analytics
roadmap. Worked with wide variety of data and implicated diverse set or library and created algorithms
to extract useful insights. To have an conspicuous grasp or better understanding I'm enlisting fewer projects down below,
which I have analogously been part of and that synonymously helped me in ameliorating my aptitude.
Forecasting Application - Starts and Budget Allocation Optimization
December 2020
Assisted University of Phoenix in forecasting the number of Application-Starts, they would receive
each month, by Last Touch Channel. The Python model reflects seasonality and is dependent on
Channel Budgets and Conversion Rates. The additional benefit of this model is its ability to capture the
impact of each channel on the number of Application-Starts, which eventually helps the university in
their budget allocation for channels. The tools we used for the project were Excel, Python and Adobe
Analytics. The forecasting techniques we utilized were ARIMA, SARIMAX, Logarithmic-Regression with
One-Hot-Encoding and Holt's.
Market Response Model - Creating Scalable-Efficient Data Pipeline Architecture
May 2020
Built a response model that boosted the efficiency of a marketing campaign by predicting accurate
responses to a service/product. The data collected, was of about 2200 people and it incorporated their
family details, food consumption details and responses to various ad-campaigns. The model, using
Stepwise Regression, removed the least independent variables and then ran Factor Analysis on the
extracted variables. The reformed datasets were trained and tested on various models such as General
Linear Model, Linear Discriminant Analytical Model, Quadratic Discriminant Analytical Model, Decision
Tree Model and Random Forest Models.
Recommendation System - Social Network Analysis
August 2020
Developed an Item-Item Similarity based Recommendation system, which was amalgamated with
Graphical Network Measures to make co-purchasing recommendations for a user. The similarity
measure took into consideration Clustering-Coefficient, Degree Centrality, Similarity with other
co-purchases, Sales-Rank, Average-Ratings and Total Reviews it had garnered.
About Care - Volunteer Optimization
February 2021
Project description - Helped About Care, an NGO in minimizing the commute, their volunteers had to
make, to proffer their services to the assigned client. We took the residence data of 180 volunteers
and 335 clients and used Google API to form a Distance Matrix between each volunteer and client. We
then used Python and Excel for the Decision Assignment Matrix between volunteer and client.
Line Of Balance Scheduling Technique - Multi-Building Project
Jan-May 2020
Project description
• Led project team to conduct on-site research and gather data
• Performed a Time-Analysis, Network-Analysis and Root-Cause Analysis
• Results suggested that the improper networking led them to a delay of about 8 months
Building a Big Data Pipeline with AWS Quicksight, Druid, and Hive
October 2021
Used the dataset on aviation for analytics to simulate a complex real-world big data pipeline based on
messaging with AWS Quicksight, Druid, NiFi, Kafka, and Hive.
• End-to-end implementation of Big data pipeline on AWS.
• Scalable, reliable, secure data architecture followed by top notch Big data leaders.
• Detailed explanation of V's in Big Data and data pipeline building and automation of the processes.
• Real time streaming data import from external API using NiFi.
• Build both Batch and streaming data pipeline on AWS from NiFi.
• Wrote the data into HDFS (batch) and Kafka(streaming ingestion) using NiFi.
• Ingested the data into Druid using HDFS(batch ingestion) as well as Kafka( real time).
• Compared the performance of Druid or Hive.
• Discussed limitations and opportunities with Druid and Hive.
• Hive external table creation on top of Hadoop distributed file system (HDFS) data.
• Performing ETLs which are widely used in the industry on top of Hive data and storing into managed
table.
• Visualizing Hive data using AWS Quicksight to calculate some of the KPIs in Aviation data.
Walmart Sales Forecasting Data Science Project
August 2021
Data Science Project in R-Predict the sales for each department using historical markdown data from
the Walmart dataset containing data of 45 Walmart stores.
• Performed basic EDA to familiarize with the data.
• Took care of missing values and datatype issues in the data.
• Understood the unique key in different data and merging the data.
• Performed Univariate analysis for both numeric and categorical variables.
• Performed Bi-variate analysis to identify redundant variables.
• Plotted Trend of each predictor with the target variable.
• Did in-depth analysis on the impact of Date/Week on Sales.
• Created new features that might add value to the model.
• Defined a function for each set of code that might need to be repeated again.
• Prepared the data for modelling.
• Made prediction using statistical techniques.
• Made model using machine learning techniques.
• Created time series ARIMA models and learn to give their parameters.
• Performed Hyper-parameter tuning to get the best parameters.
• Learned how to make predictions where data is sparse.
• Compared the performance of different models using multiple metrics.
Contact Me
Elements
Text
This is bold and this is strong. This is italic and this is emphasized.
This is superscript text and this is subscript text.
This is underlined and this is code: for (;;) { ... }. Finally, this is a link.
Heading Level 2
Heading Level 3
Heading Level 4
Heading Level 5
Heading Level 6
Blockquote
Fringilla nisl. Donec accumsan interdum nisi, quis tincidunt felis sagittis eget tempus euismod. Vestibulum ante ipsum primis in faucibus vestibulum. Blandit adipiscing eu felis iaculis volutpat ac adipiscing accumsan faucibus. Vestibulum ante ipsum primis in faucibus lorem ipsum dolor sit amet nullam adipiscing eu felis.
Preformatted
i = 0;

while (!deck.isInOrder()) {
    print 'Iteration ' + i;
    deck.shuffle();
    i++;
}

print 'It took ' + i + ' iterations to sort the deck.';
Lists
Unordered
- Dolor pulvinar etiam.
- Sagittis adipiscing.
- Felis enim feugiat.
Alternate
- Dolor pulvinar etiam.
- Sagittis adipiscing.
- Felis enim feugiat.
Ordered
- Dolor pulvinar etiam.
- Etiam vel felis viverra.
- Felis enim feugiat.
- Dolor pulvinar etiam.
- Etiam vel felis lorem.
- Felis enim et feugiat.
Icons
Actions
Table
Default
| Name | Description | Price |
|---|---|---|
| Item One | Ante turpis integer aliquet porttitor. | 29.99 |
| Item Two | Vis ac commodo adipiscing arcu aliquet. | 19.99 |
| Item Three | Morbi faucibus arcu accumsan lorem. | 29.99 |
| Item Four | Vitae integer tempus condimentum. | 19.99 |
| Item Five | Ante turpis integer aliquet porttitor. | 29.99 |
| 100.00 | ||
Alternate
| Name | Description | Price |
|---|---|---|
| Item One | Ante turpis integer aliquet porttitor. | 29.99 |
| Item Two | Vis ac commodo adipiscing arcu aliquet. | 19.99 |
| Item Three | Morbi faucibus arcu accumsan lorem. | 29.99 |
| Item Four | Vitae integer tempus condimentum. | 19.99 |
| Item Five | Ante turpis integer aliquet porttitor. | 29.99 |
| 100.00 | ||